17 Aug 2026
- 0 Comments
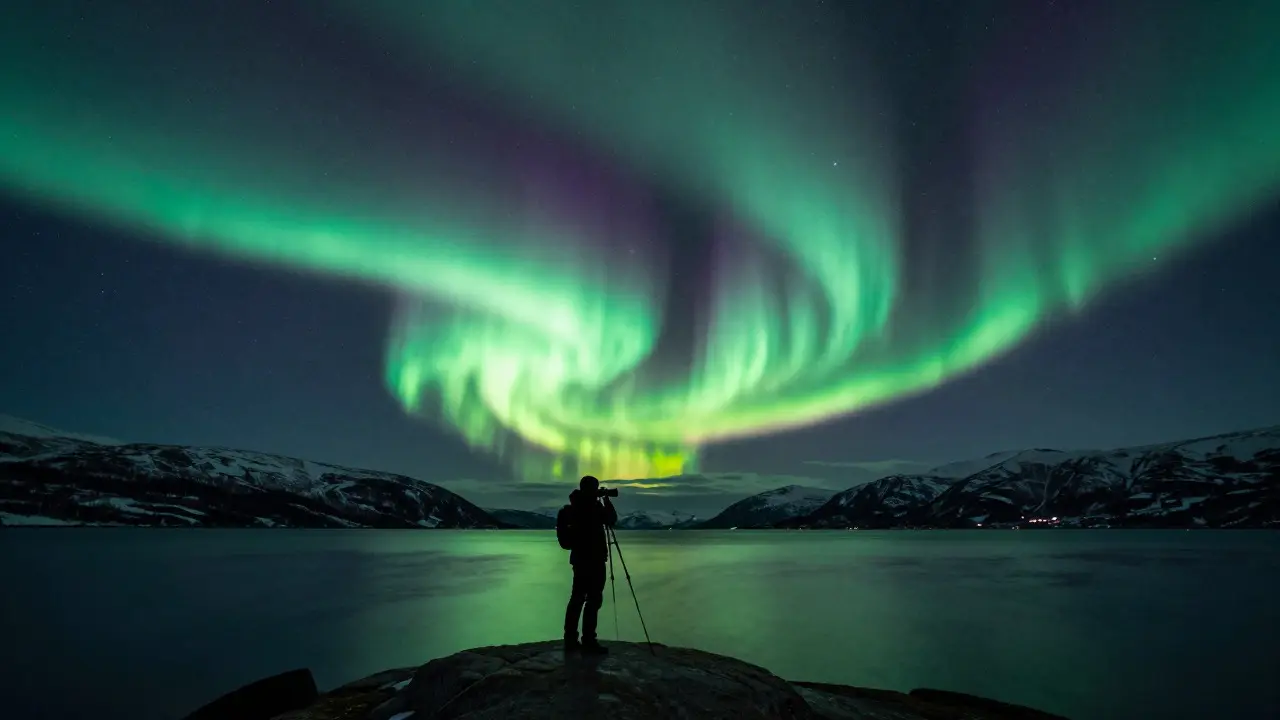
On a crisp November night in Tromsø, Norway, a photographer snaps a photo of the green curtains dancing above the fjord. Within minutes, that image is uploaded to a global database, tagged with location and intensity, and used by scientists to refine models of solar wind interaction. This is Aurora Reporting in action: a decentralized network where everyday observers act as sensors for Earth’s upper atmosphere.
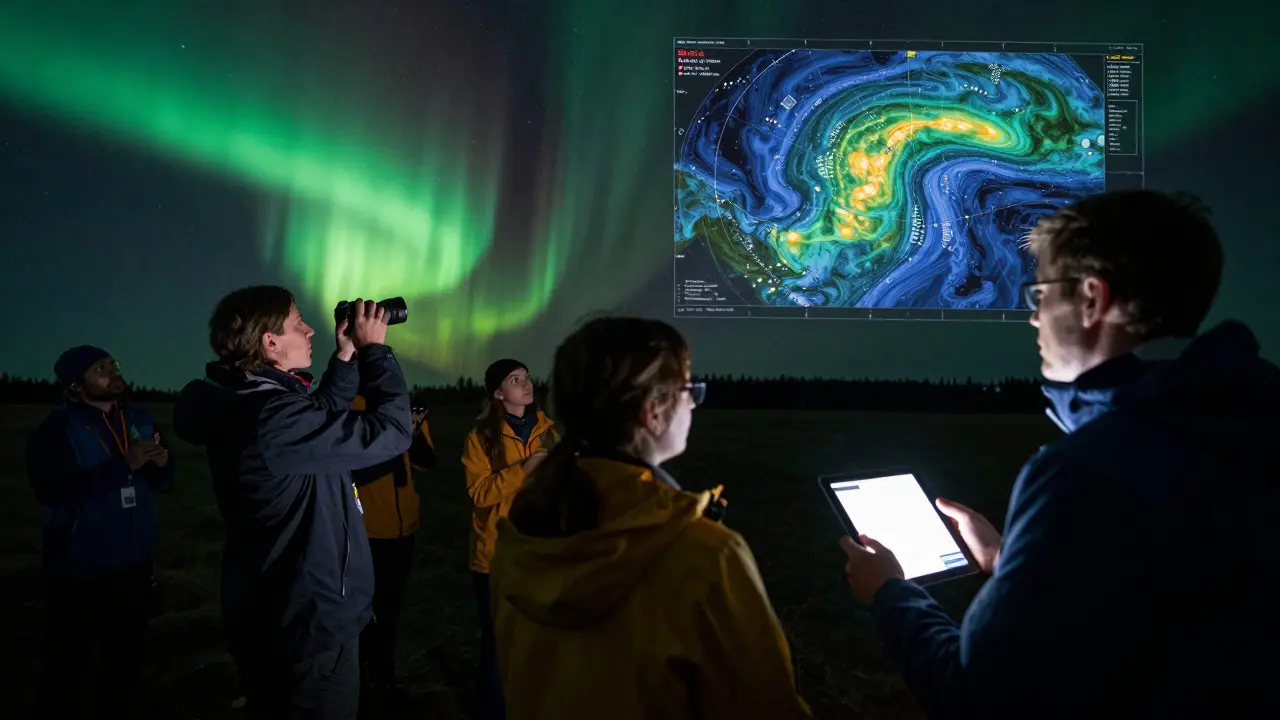
For decades, monitoring space weather relied heavily on expensive satellites and ground-based magnetometers. While these tools provide precise data, they cover limited areas. The gap between these fixed points is filled by human eyes. By aggregating thousands of reports from citizens worldwide, researchers create a real-time map of geomagnetic activity that no single satellite can match alone.
The Mechanics of Light: What We Are Actually Seeing
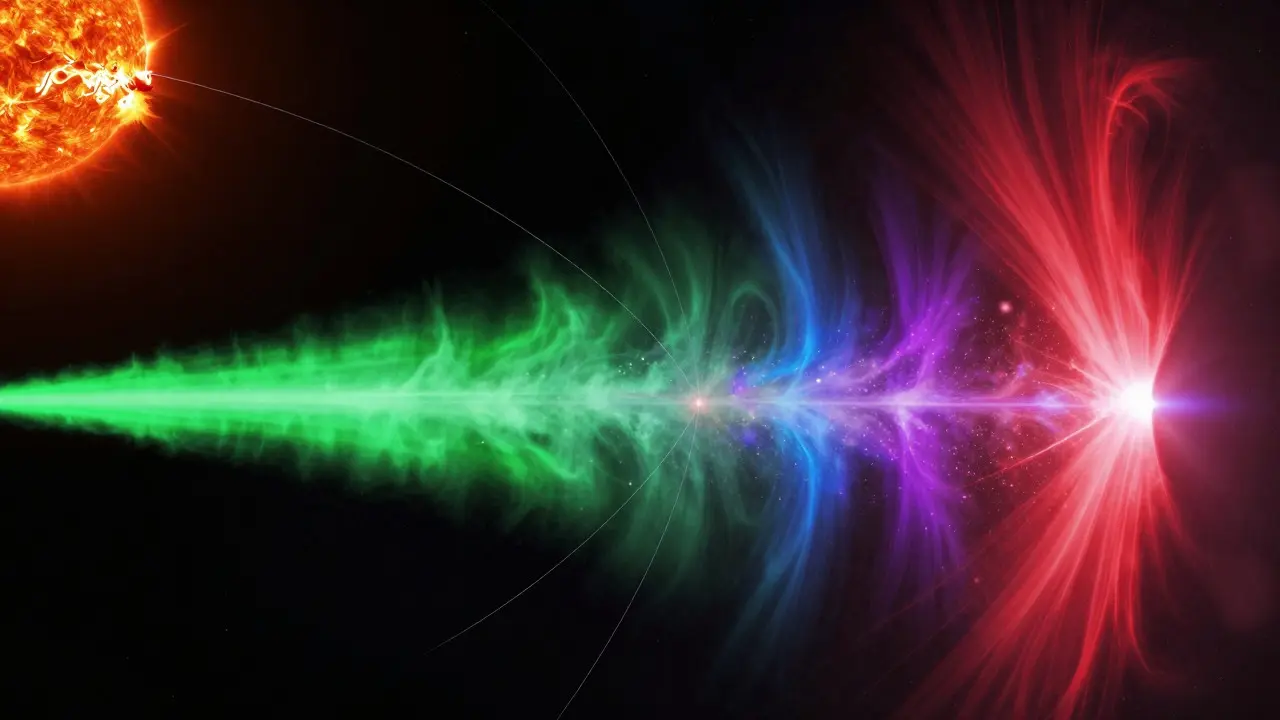
To understand why your report matters, you need to know what triggers the display. When charged particles from the sun-specifically during a coronal mass ejection or solar wind stream-hit Earth’s magnetic field, they are funneled toward the poles. These particles collide with oxygen and nitrogen atoms in the thermosphere. Oxygen emits red and green light; nitrogen produces blue and purple hues. The altitude of the collision determines the color: green appears around 100 km, while red can stretch up to 300 km.
This physical process is consistent, but its visibility varies wildly based on local conditions. A clear sky at high latitude might show a faint arc that is invisible from a city center due to light pollution. This variability is exactly why citizen networks are superior to isolated instruments. They capture the spatial extent of the auroral oval, showing how far south or north the activity has pushed on any given night.
How Citizen Science Bridges the Data Gap
Citizen Science is a research model that involves volunteers in scientific collection, processing, or analysis of data. In the context of space weather, this means turning phone cameras and human perception into valid scientific instruments. Platforms like the Borealis app or the Global Geomagnetic Index (Kp) community logs allow users to submit photos, video clips, or simple text descriptions.
The value lies in density. Satellites orbit every 90 minutes, providing snapshots. Ground stations measure magnetic field fluctuations at specific coordinates. But an aurora is a fluid, expanding structure. If 50 people in Sweden, Finland, and Norway all report seeing the lights simultaneously, scientists can calculate the speed and direction of the wavefront. This data helps predict when the next pulse of energy will hit other regions, giving power grid operators and radio communication teams critical lead time.
Key Metrics: K-Index, G-Scale, and Visual Intensity
When submitting a report, consistency is key. Scientists use standardized scales to quantify what you see. Understanding these terms ensures your data integrates smoothly with professional measurements.
| Scale Name | What It Measures | Range | Primary Use Case |
|---|---|---|---|
| Kp Index | Global geomagnetic disturbance level | 0 to 9 | Predicting storm onset globally |
| G-Scale | Geomagnetic storm severity | G0 to G5 | Assessing impact on power grids/satellites |
| Visual Intensity (Borealis) | Brightness and coverage from ground view | 1 to 5 | Mapping local visibility and color |
The Kp index is derived from eight ground-based magnetometers spaced around the globe. A Kp of 5 indicates a minor storm, often visible near the poles. A Kp of 7 or higher signals a major storm, potentially visible as far south as the US Midwest or Europe. However, Kp is a global average. Your local experience might be intense even if the global Kp is moderate, due to localized substorms. This is where visual intensity ratings become crucial-they anchor the global data to specific geographic locations.
Building Your Observation Protocol
You don’t need a professional telescope or a calibrated photometer to contribute valuable data. In fact, over-specialized gear can sometimes distort the data by introducing lens artifacts. Here is a practical protocol for effective reporting:
- Check Conditions First: Before heading out, verify the cloud cover forecast and the current Kp index. Clear skies are non-negotiable for visual confirmation.
- Use Manual Camera Settings: Auto-exposure often washes out the colors. Set your ISO between 800 and 3200, aperture wide open (f/2.8 or lower), and shutter speed between 4 and 10 seconds. This captures motion without blurring the stars excessively.
- Include Reference Points: Frame your shot to include recognizable landmarks or cardinal directions. Knowing if the aurora was overhead or on the northern horizon helps scientists determine the altitude of the emission.
- Note the Time Precisely: Use UTC (Coordinated Universal Time) if possible, or clearly state your local timezone. Auroral events can evolve in minutes; a timestamp error of 15 minutes can misalign your data with satellite passes.
- Describe Color and Motion: Did it look static or rippling? Was it primarily green, or did you see fringes of pink/purple? Purple often indicates lower altitudes and higher energy collisions, which is distinct scientific information.
Why Your Data Matters for Technology Resilience
Space weather isn’t just about pretty lights. Strong geomagnetic storms induce currents in long conductors on Earth’s surface. This phenomenon, known as Geomagnetically Induced Currents (GICs), can overload transformers in power grids. In 1989, a massive storm caused a blackout in Quebec that left millions without power for nine hours. More recently, in 2024, significant GICs were recorded across Europe and North America during a strong solar event.
Citizen reports help identify the leading edge of these disturbances. If multiple observers in Scandinavia report sudden brightening and rapid movement, grid operators can anticipate increased load on their systems. Similarly, shortwave radio communications can be disrupted by ionospheric disturbances. Pilots on polar routes rely on accurate space weather forecasts to choose safe frequencies. Your timely report contributes directly to the safety and reliability of modern infrastructure.
Common Pitfalls and How to Avoid Them
Even experienced observers make mistakes that reduce data quality. Watch out for these common issues:
- Light Pollution Bias: Don’t assume the aurora is "weak" just because it’s dim in a city. It might be strong but obscured. Always note your Bortle scale rating (light pollution level) when submitting.
- Moon Interference: A full moon can wash out faint auroras. If you report nothing seen during a high-Kp event under a bright moon, specify that. Absence of evidence is not evidence of absence, but context clarifies it.
- Double Counting: If you post the same event on three different platforms, ensure you link them or note it as a duplicate. Duplicate entries can skew statistical models of frequency and duration.
- Ignoring Video Metadata: If you upload video, keep the original file. Compressed social media versions often strip GPS and timestamp metadata, which are vital for geolocation.
The Future of Distributed Space Weather Monitoring
The integration of AI with citizen data is accelerating. Machine learning algorithms now analyze submitted photos to automatically detect auroral presence and estimate brightness levels, reducing the manual workload for scientists. This allows for near-instantaneous updates to global dashboards. Furthermore, low-cost IoT sensors are being deployed in remote areas, combining automated magnetic field readings with nearby citizen visual confirmations to create a hybrid sensor network.
As solar cycles peak and trough, the demand for high-resolution space weather data only grows. The partnership between professional observatories and public observers creates a robust, resilient system. You don’t need to be an astronomer to participate. You just need curiosity, a camera, and a willingness to share what you see. Every report adds a pixel to the global picture, helping us understand our dynamic relationship with the sun.
Do I need expensive equipment to report auroras?
No. A smartphone with a decent camera is sufficient for most reports. The key is capturing the event accurately with correct timestamps and location tags. Professional cameras offer better low-light performance, but they are not required for the data to be scientifically useful.
What is the difference between a solar flare and a coronal mass ejection?
A solar flare is a sudden burst of radiation, primarily X-rays and ultraviolet light, that travels at the speed of light. A coronal mass ejection (CME) is a massive cloud of plasma and magnetic fields ejected from the sun’s corona. CMEs travel slower (taking 1-3 days to reach Earth) but carry the particles that cause geomagnetic storms and visible auroras.
How often should I check space weather forecasts?
During active periods, check forecasts daily. During quiet periods, checking once a week is sufficient. Key resources include the NOAA Space Weather Prediction Center and various citizen science apps that push notifications when Kp indices rise above certain thresholds.
Can auroras be seen outside the polar regions?
Yes, during strong geomagnetic storms (Kp 6+), auroras can expand significantly equatorward. Locations like the UK, Germany, and the northern United States have recorded sightings during major events. However, these events are less frequent than polar occurrences.
Why do auroras usually appear green?
Green is the most common color because it is produced by oxygen atoms at altitudes between 100 and 250 kilometers. This is the most populated region of the auroral oval. Red and purple require higher energies or different atmospheric densities, making them rarer and typically found at higher altitudes or during intense storms.