5 Sep 2026
- 0 Comments
You just spent three hours setting up your telescope in the backyard, only to realize you forgot to check if the variable star you want to observe is actually visible above the horizon. Or worse, you captured a beautiful image of R Lyrae, but when you sat down to reduce the data, you couldn't find good comparison stars nearby because they were too crowded or out of frame. These aren't hypothetical scenarios; they are the daily frustrations of amateur astronomers trying to contribute meaningful variable star photometry data.
The difference between a wasted night and a productive one often comes down to preparation. While many beginners dive straight into capturing images, experienced observers know that the real work happens before the shutter opens. This is where planetarium software becomes more than just a stargazing map-it transforms into a precision planning tool. By simulating the sky ahead of time, you can predict exactly which comparison stars will be available, how much light pollution will interfere, and whether your target will remain high enough for accurate measurements. It’s not about cheating the science; it’s about optimizing your limited observing time so that every minute under the stars counts toward valid data collection.
Why Planning Beats Guessing in Photometry
Variable star photometry is the process of measuring the brightness changes of stars over time. Unlike visual observation, where you might just note that a star looks dimmer, photometry requires precise numerical values. To get these numbers, you compare your target star against known reference stars, called comparison stars, in the same field of view. If those comparison stars are missing, too bright, or too faint, your data is useless.
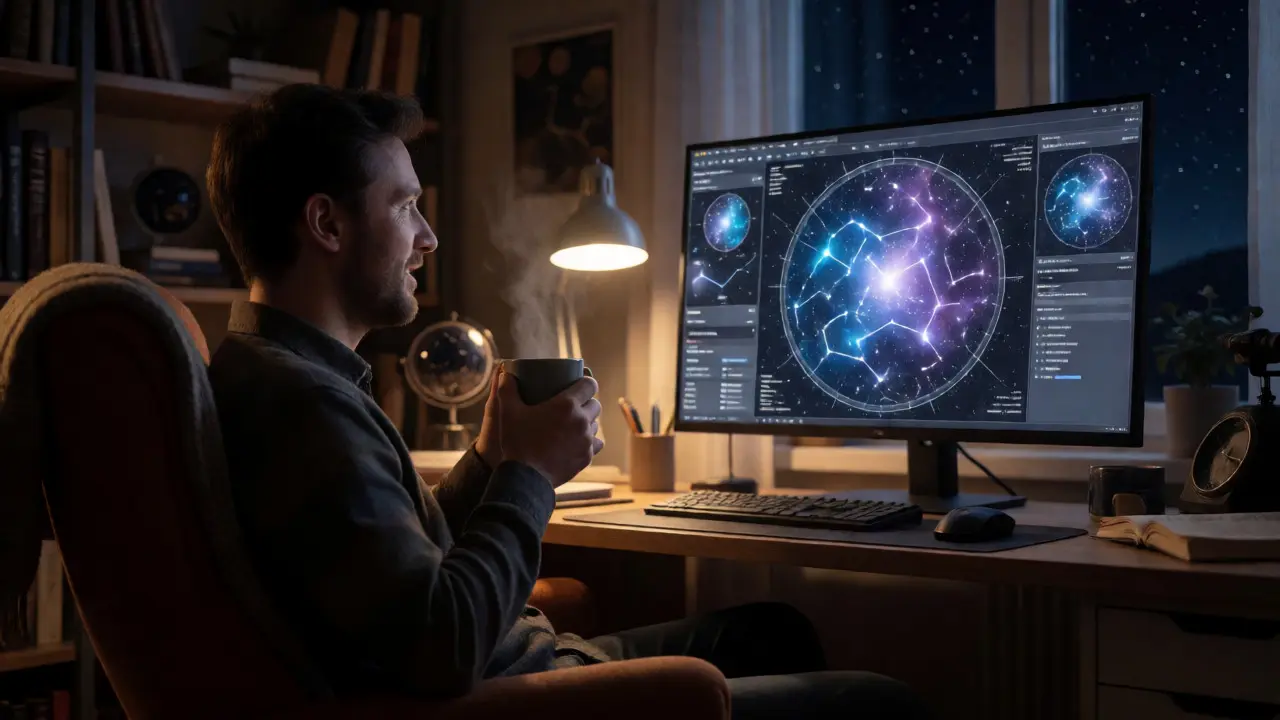
This is where simulation saves you from disaster. Imagine you plan to observe Mira Ceti during its maximum brightness. Without checking first, you might set up your telescope at midnight, only to find that the moon is rising and washing out the fainter comparison stars you need. Or perhaps you choose a wide-field lens, expecting plenty of reference stars, but discover later that the area around your target is surprisingly empty. By using software like Stellarium or TheSkyX to simulate the exact date, time, and location of your observation, you can identify these pitfalls weeks in advance. You stop reacting to problems in the cold and start solving them in the warmth of your home office.
Selecting the Right Comparison Stars Before You Observe
The heart of successful photometry lies in choosing the right comparison stars. Ideally, you want stars that are close to your target in magnitude (brightness) and color, and located within the same field of view. But how do you know which stars fit this description without taking test images? You use the catalog data integrated into your planetarium software.
Most modern planetarium programs allow you to overlay specific star catalogs, such as the AAVSO (American Association of Variable Star Observers) charts or the USNO-B1 catalog. Here is a practical workflow:
- Set your parameters: Input your latitude, longitude, and the specific date and time of your planned observation.
- Locate the target: Find the variable star you intend to measure. Use the software’s search function to center it perfectly.
- Overlay catalogs: Enable the display of comparison star catalogs. Look for stars marked with specific identifiers used by professional databases.
- Evaluate proximity and magnitude: Check the distance between your target and potential comparison stars. Are they within 5-10 arcminutes? Are their magnitudes within 1-2 magnitudes of your target?
- Check altitude: Ensure the entire group of stars (target plus comparisons) will be high in the sky (above 30 degrees altitude) to minimize atmospheric extinction errors.
By doing this digitally, you can create a "shopping list" of stars. For example, if you’re observing Delta Cephei, you might note that Star A is ideal but will set below the horizon by 2 AM, while Star B remains visible all night. This knowledge dictates your exposure timing and helps you avoid losing critical data points halfway through the session.
| Software | Catalog Integration | Altitude/Azimuth Precision | Best For |
|---|---|---|---|
| Stellarium | Basic (AAVSO via plugins) | High | Quick checks and visual planning |
| TheSkyX | Advanced (USNO, GSC, Tycho) | Very High | Professional-grade pre-planning |
| SkySafari Pro | Moderate | Good | Mobile field assistance |
| Cartes du Ciel | Excellent (Free catalogs) | High | Detailed chart creation |
Simulating Atmospheric Conditions and Light Pollution
Your telescope doesn’t operate in a vacuum. The Earth’s atmosphere absorbs and scatters light, affecting both your target and your comparison stars differently depending on their position in the sky. This phenomenon, known as atmospheric extinction, becomes severe when stars are low on the horizon. If your target is high but your comparison star is low, your brightness measurements will be skewed unless you apply complex corrections.
Planetarium software allows you to visualize this risk. By animating the sky movement over several hours, you can see if your chosen comparison stars will drop too low during your observing window. Some advanced tools even let you input local light pollution levels (using the Bortle scale) to simulate how faint stars will appear. If the software shows that your comparison stars will disappear due to twilight or city glow, you know immediately that you need to adjust your schedule or choose different references.
Consider a scenario involving an eclipsing binary like Algol. Its eclipse lasts only a few hours. If you plan to observe it from Portland, Oregon, in late September, the sun sets early. You need to ensure your target is well-positioned after full darkness falls. Simulating this in software reveals that waiting until 9 PM might push the target too close to the western horizon, introducing significant error. Moving your start time to 8:30 PM keeps the star higher, ensuring cleaner data.
Creating Custom Observation Charts
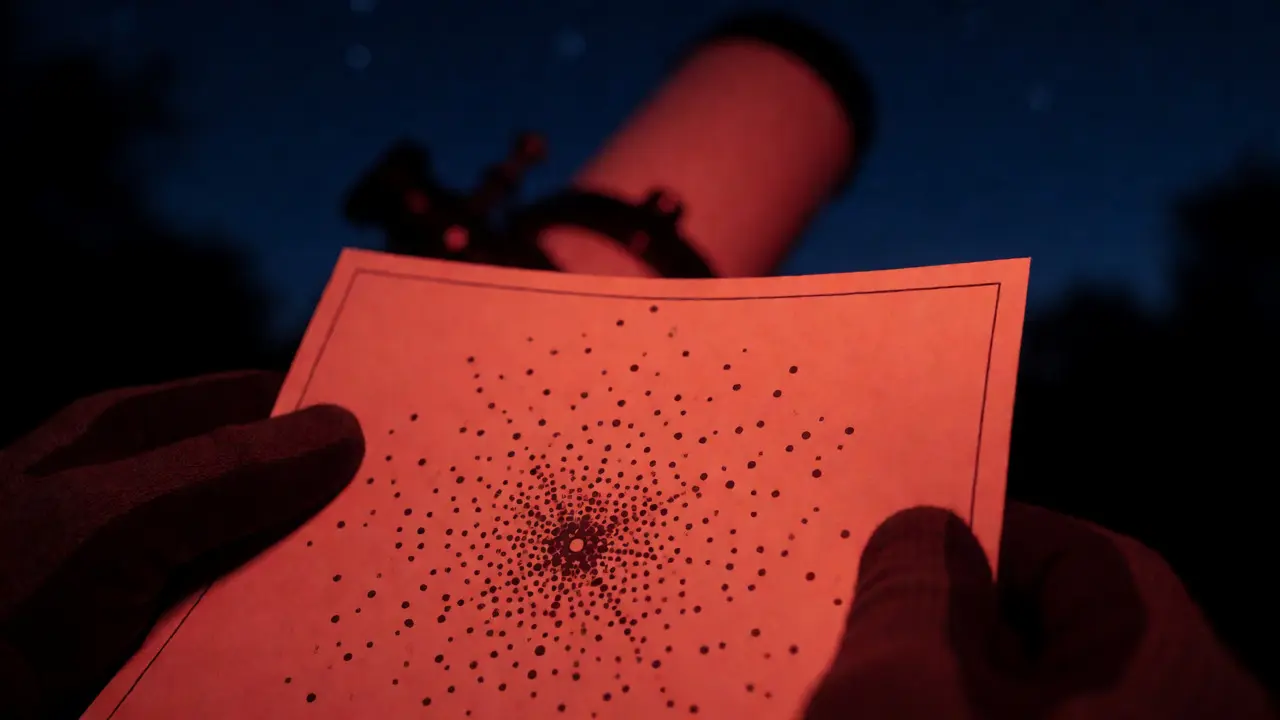
Once you’ve selected your stars and verified their visibility, the next step is creating a physical or digital chart to take outside. Trying to remember which dot corresponds to which star while fumbling with a red flashlight is prone to error. Instead, generate a custom finder chart directly from your simulation.
Tools like Cartes du Ciel or the chart-making features in Stellarium allow you to export PDFs or PNGs that show exactly what your camera or eyepiece will see. You can customize these charts to highlight only the relevant comparison stars, ignoring the clutter of irrelevant background stars. Mark the target star clearly and label each comparison star with its ID and magnitude. When you’re out in the field, you simply match the pattern in your viewfinder to the paper in your hand. This reduces cognitive load, allowing you to focus on focusing the telescope and monitoring the weather rather than searching for reference points.
Furthermore, these charts serve as a record of your planning process. If your data looks strange months later, you can refer back to the chart to see if there was a known issue with a specific comparison star-perhaps it was itself a variable star that you didn’t realize was fluctuating.
Integrating Simulation with Real-Time Data Capture
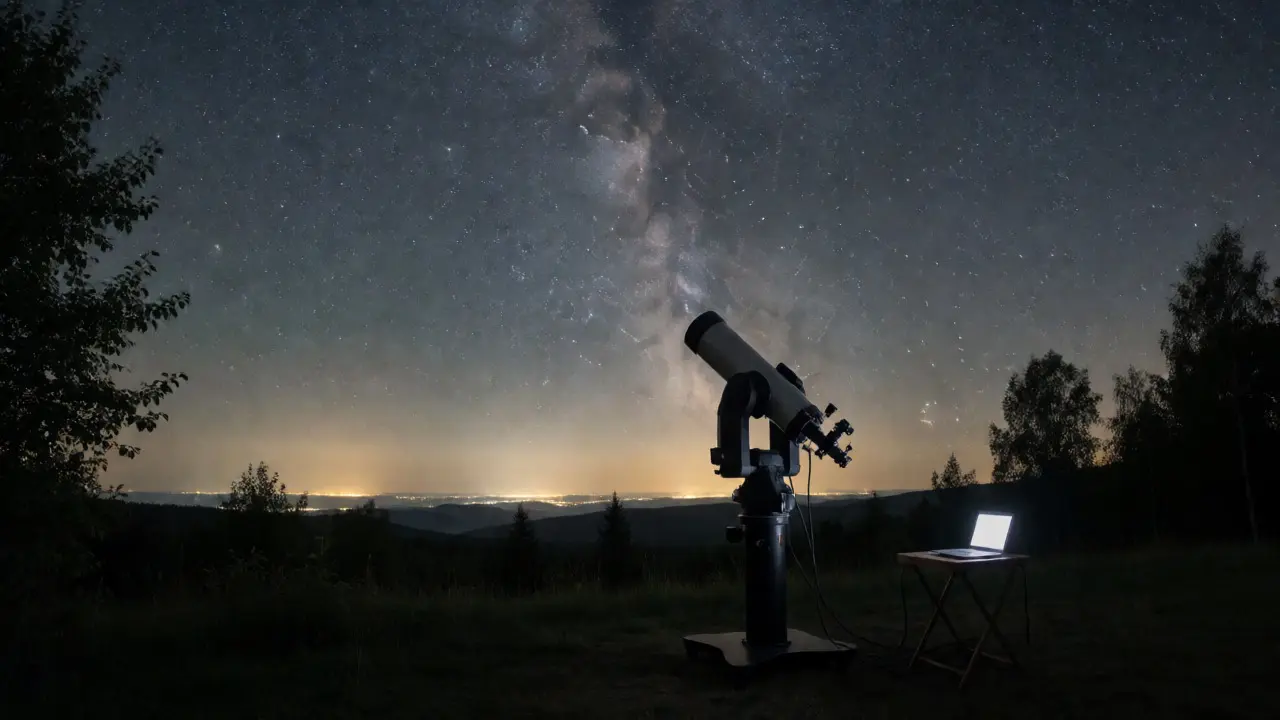
While planning is crucial, technology has bridged the gap between simulation and reality. Many modern astrophotography suites, such as N.I.N.A. or SharpCap, integrate with planetarium software via ASCOM or INDI protocols. This means your planning software can send coordinates directly to your mount, automating the slewing process.
For photometry, this integration offers a subtle but powerful advantage: consistency. If you manually enter coordinates, typos happen. If you copy-paste from a simulated chart, errors persist. But if the software drives the mount, the pointing accuracy is consistent across multiple nights. This consistency is vital for long-term projects tracking slow variables, where slight pointing differences between nights can introduce noise into your light curves.
Additionally, some software allows you to define "observation sequences." You can program the system to slew to the target, take a series of exposures, then slew to a calibration star, all based on the positions you verified in the simulation phase. This turns a chaotic manual process into a streamlined pipeline, reducing human error and maximizing the number of usable data points per hour.
Troubleshooting Common Planning Pitfalls
Even with careful simulation, things can go wrong. Here are common issues and how to address them:
- Crowded Fields: Sometimes the software shows plenty of stars, but your actual image is saturated or blended. Solution: Zoom in further in the simulation to check star density. If stars are closer than your seeing conditions allow, switch to a shorter focal length or choose a different target.
- Twilight Interference: You planned for dark skies, but civil twilight lingered longer than expected. Solution: Always add a 30-minute buffer to your simulation start times. Check the solar elevation angle carefully; true darkness begins when the sun is 18 degrees below the horizon.
- Cloud Cover Mismatches: Your forecast said clear, but clouds rolled in. Solution: Have backup targets ready. Use your software to pre-plan two or three alternative variables in different parts of the sky. If one is clouded out, you can quickly slew to the backup without losing the night.
Remember, the goal isn't perfection; it's resilience. Good planning gives you options when nature throws a curveball.
Do I need paid planetarium software for photometry planning?
Not necessarily. Free software like Stellarium and Cartes du Ciel are excellent for most amateur needs. They provide accurate sky simulations and basic catalog overlays. Paid versions often offer better integration with telescope control systems and more detailed star catalogs, but you can achieve high-quality results with free tools if you learn their interfaces well.
How far in advance should I plan my photometry sessions?
Ideally, one to two weeks in advance. This allows you to check lunar phases, weather trends, and target visibility windows thoroughly. However, you should also do a final "sanity check" simulation on the day of the observation to account for any last-minute changes in equipment setup or unexpected weather shifts.
What if my comparison stars are not listed in the default catalog?
You may need to download additional catalogs. For variable star work, the AAVSO provides specific charts and catalogs that include non-standard stars. Importing these into your software ensures you have access to the precise magnitude data required for accurate reduction. Always verify the epoch and equinox of the catalog matches your software settings.
Can I use mobile apps for this type of planning?
Yes, apps like SkySafari Pro are powerful and portable. They are great for quick checks and field adjustments. However, desktop software generally offers superior detail for generating printable charts and managing complex multi-night sequences. A hybrid approach-desktop for deep planning, mobile for field execution-is often the most efficient.
How does light pollution affect my choice of comparison stars?
Light pollution raises the sky background brightness, making faint stars harder to detect. In heavily polluted areas, you must choose brighter comparison stars that stand out above the noise. Simulation software can help you estimate which stars will be visible given your local Bortle scale rating, preventing you from selecting references that will vanish in your actual images.