17 Aug 2026
- 0 Comments
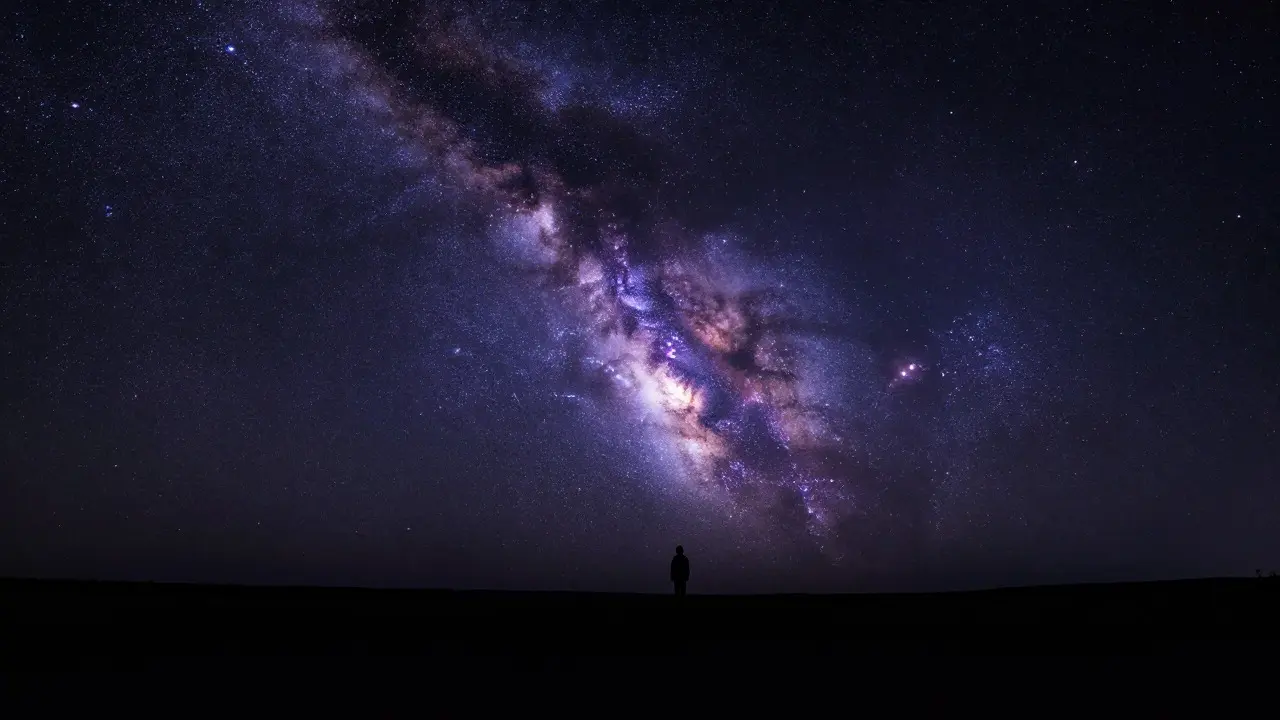
Look straight up. That’s the spot. Astronomers call it your zenith, the point directly overhead on the celestial sphere. It is the single most important location for measuring ambient sky glow because it represents the cumulative effect of all artificial light scattering through the atmosphere above you. If you want to know how dark your night really is, or if your local light pollution is getting worse, this is where you start.
Why the Zenith Matters More Than the Horizon
Many beginners make the mistake of pointing their instruments toward the brightest part of the sky, usually near the horizon where city lights bleed into the darkness. While that area is certainly bright, it is also highly variable due to terrain, clouds, and specific building layouts. The zenith provides a standardized reference point. By measuring here, you get a value that correlates with the overall magnitude of light pollution in your region, regardless of local obstructions.
The International Association for Light Pollution Action (IALA) recommends zenith measurements for long-term monitoring because they are less susceptible to short-term fluctuations like passing cars or temporary cloud cover. When you measure at the zenith, you are essentially sampling the entire column of air above you. This makes the data comparable across different locations and over time, which is crucial for tracking trends in urban sprawl and lighting changes.
Essential Tools for Accurate Measurement
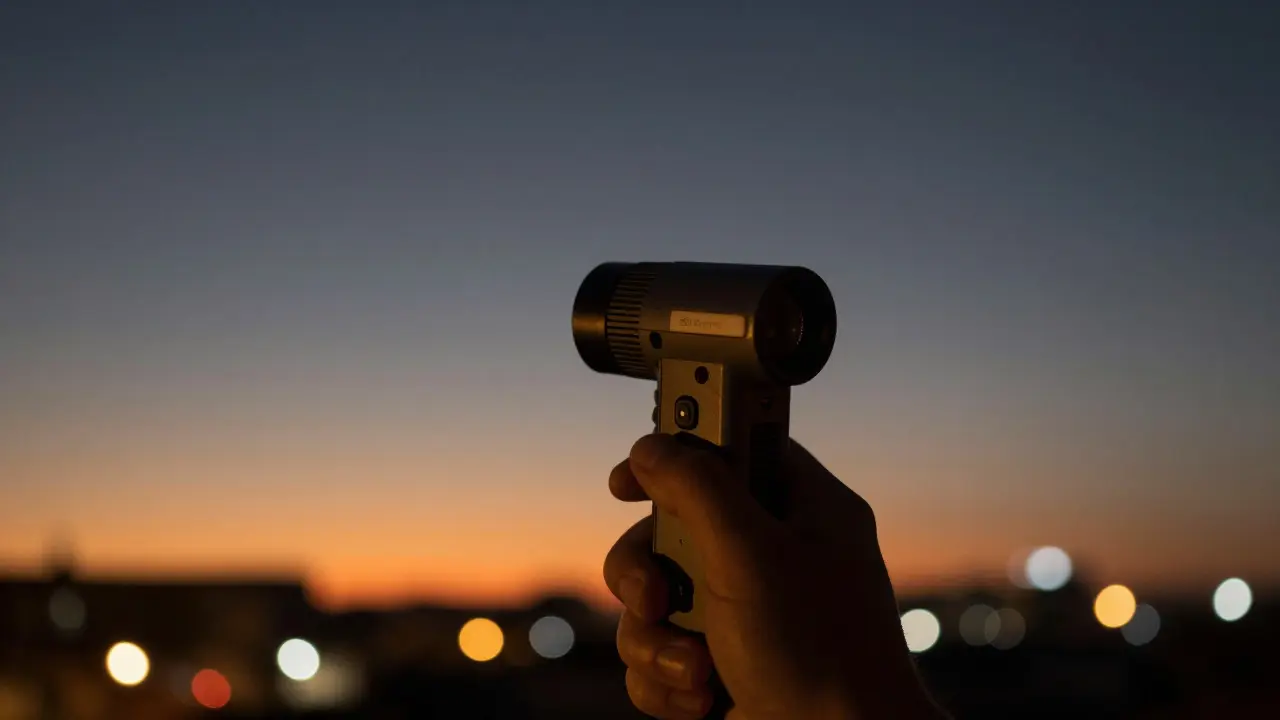
You don’t need a million-dollar observatory setup to get reliable data. However, using the right tools matters significantly. The gold standard for citizen science is the Unihedron SQM-L (Sky Quality Meter). This handheld device measures sky brightness in magnitudes per square arcsecond (mag/arcsec²).
- SQM-L: The industry standard. It has a built-in photodiode and filters out moonlight interference automatically in many modes. Cost: ~$150 USD.
- Smartphone Apps: Apps like "Sky Quality" or "Dark Site Finder" can provide rough estimates using your phone's camera sensor. These are good for quick checks but lack the precision of dedicated hardware.
- DSLR Cameras: For advanced users, taking a calibrated long-exposure photo (e.g., 30 seconds at ISO 800, f/4) and analyzing the histogram can yield accurate results if processed correctly.
If you are just starting out, an SQM-L is worth every penny. It gives you immediate feedback and allows you to log data easily. If budget is tight, try the smartphone method first, but remember that phone sensors vary wildly between models, so consistency is key. Always use the same device for longitudinal studies.
Step-by-Step: How to Take a Zenith Reading
Getting a clean reading requires discipline. Follow these steps to ensure your data is valid:
- Choose the Right Night: Pick a moonless night. The moon is the biggest source of natural variability. Avoid nights with significant cloud cover. A clear, dry night is ideal.
- Wait for Dark Adaptation: Give your eyes 20-30 minutes to adjust to the dark. Use a red flashlight if you need to see anything. Blue light from phones will ruin your adaptation instantly.
- Find Open Sky: Stand in a location with no trees, buildings, or streetlights blocking your view directly overhead. You need a 180-degree field of view if possible, but at minimum, a clear path to the zenith.
- Position the Device: Point the SQM-L or camera lens exactly 90 degrees up. Use a tripod with a ball head for stability. Ensure the lens is not shaded by your body or the tripod legs.
- Take Multiple Readings: Don’t rely on a single number. Take at least five readings spaced 30 seconds apart. Average them out. This helps smooth out minor atmospheric turbulence or transient light sources.
- Log the Data: Record the date, time, location coordinates, weather conditions, and the average brightness value. Note any nearby construction or new lighting installations.
Understanding the Numbers: Bortle Scale vs. Magnitudes
When you get a number from your SQM, say 19.5 mag/arcsec², what does that actually mean? It’s easy to get confused between the Bortle Scale (a qualitative 1-9 rating) and physical magnitudes. Here is how they relate:
| Bortle Class | Description | Typical Zenith Brightness (mag/arcsec²) | Naked Eye Limiting Magnitude |
|---|---|---|---|
| 1 | Excellent Dark-Site | 21.9 - 22.0 | 7.6 - 7.9 |
| 3 | Rural | 20.9 - 21.0 | 7.1 - 7.3 |
| 5 | Rural/Suburban Transition | 19.9 - 20.0 | 6.6 - 6.8 |
| 7 | Bright Suburban | 18.9 - 19.0 | 6.1 - 6.3 |
| 9 | Inner City | 17.9 - 18.0 | 5.6 - 5.8 |
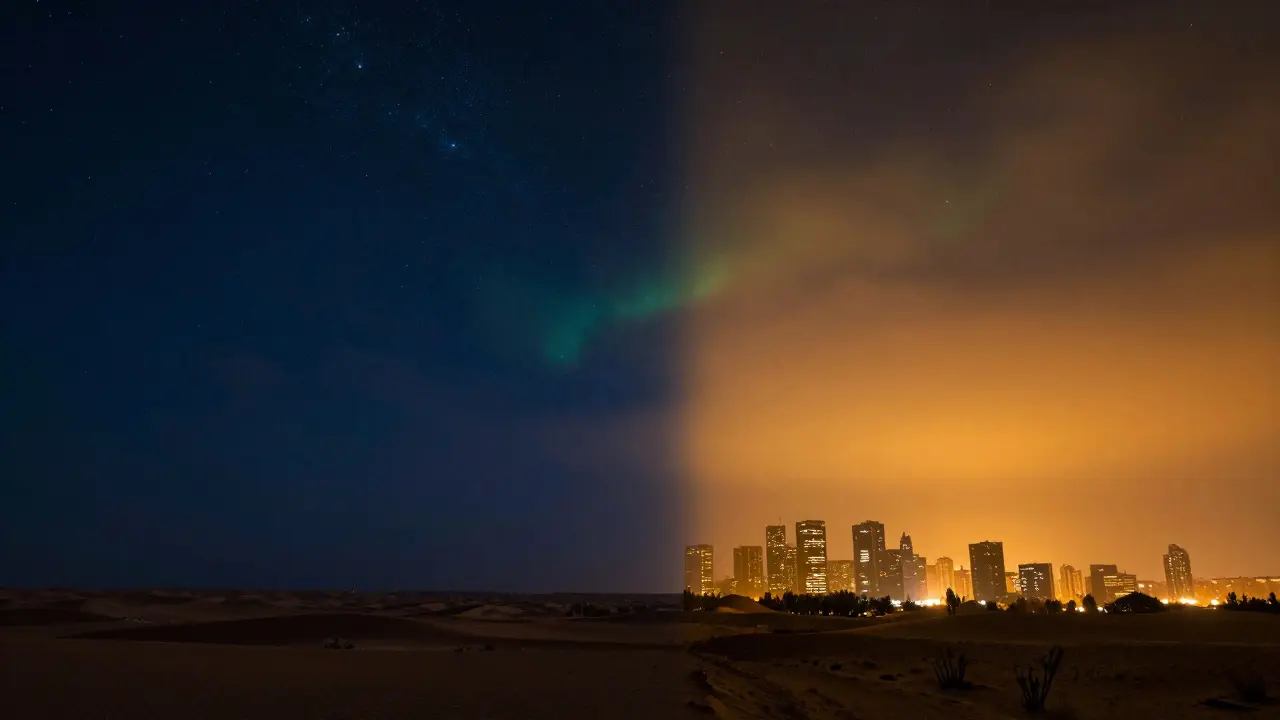
Notice the inverse relationship: lower numbers mean brighter skies. A Bortle 9 city center might read 17.9, while a remote desert site reads 21.9. That difference of 4 magnitudes translates to roughly 40 times more light pollution in the city. This exponential scale is why even small improvements in lighting efficiency can have a massive impact on perceived darkness.
Common Pitfalls That Ruin Your Data
Even experienced observers mess up basic protocols. Here are the most common errors I see in citizen science datasets:
- Moon Interference: Even a thin crescent moon adds measurable background light. If the moon is above the horizon, note its phase and altitude. Ideally, wait until it sets.
- Airglow Confusion: On very dark nights, you might see faint greenish glows high in the sky. This is natural airglow from oxygen atoms reacting with solar radiation. It is not light pollution. If you are in a Bortle 1-2 area, distinguish this from artificial glow by checking if it moves with the stars (airglow does; city glow does not).
- Lens Flare: Backlighting from bright sources can cause internal reflections in your camera or SQM lens. Ensure no bright lights are within 10 degrees of your viewing axis.
- Inconsistent Timing: Measuring at 8 PM versus midnight yields different results because the atmosphere settles and fewer people are driving at night. Standardize your measurement time window, ideally between astronomical twilight end and midnight.
Using Your Data for Advocacy
Why bother measuring? Because data drives change. Local planning commissions rarely listen to complaints about "bright lights" without evidence. If you can show that your neighborhood’s zenith brightness has increased from 19.5 to 18.5 over two years, you have a compelling argument for stricter lighting codes.
Share your data with organizations like the International Dark-Sky Association (IDA) or local astronomy clubs. Many cities now require light pollution impact assessments for new developments. Your consistent, well-documented zenith measurements can become part of that official record. Start small. Pick one spot in your backyard or a nearby park. Measure it monthly. Over a year, you’ll have a powerful dataset that tells the story of your local night sky.
What is a good zenith brightness value?
A "good" value depends on your goal. For serious astronomy, aim for 21.0 mag/arcsec² or higher (Bortle 3 or better). For general stargazing, 20.0 is acceptable. In major cities, values below 18.5 indicate severe light pollution.
Can I measure sky brightness during the day?
No. Daytime measurements are dominated by sunlight scattering, making it impossible to isolate artificial light pollution. You must measure after astronomical twilight ends, when the sun is at least 18 degrees below the horizon.
Does humidity affect sky brightness readings?
Yes. High humidity increases aerosol content in the air, which scatters more light and makes the sky appear brighter. Always note relative humidity in your logs. A 90% humidity night will read brighter than a 30% humidity night at the same location.
Is the SQM-L worth the cost compared to apps?
For casual observation, apps are fine. For advocacy, research, or consistent monitoring, yes. The SQM-L offers repeatable, calibrated data that is accepted by scientific bodies and local governments. Apps vary too much between phone models to be reliable for trend analysis.
How often should I take zenith measurements?
Monthly is ideal for tracking seasonal changes and gradual light pollution growth. Weekly is overkill unless you are studying rapid changes due to new construction. Annual comparisons are sufficient for broad policy arguments.